Economic Bulletin Issue 5, 2025
Summary
At its meeting on 24 July 2025, the Governing Council decided to keep the three key ECB interest rates unchanged. Inflation is currently at the 2% medium-term target. The incoming information is broadly in line with the Governing Council’s previous assessment of the inflation outlook. Domestic price pressures have continued to ease, with wages growing more slowly. Partly reflecting the Governing Council’s past interest rate cuts, the economy has so far proven resilient overall in a challenging global environment. At the same time, the environment remains exceptionally uncertain, especially because of trade disputes.
The Governing Council is determined to ensure that inflation stabilises at its 2% target in the medium term. It will follow a data-dependent and meeting-by-meeting approach to determining the appropriate monetary policy stance. In particular, the Governing Council’s interest rate decisions will be based on its assessment of the inflation outlook and the risks surrounding it, in light of the incoming economic and financial data, as well as the dynamics of underlying inflation and the strength of monetary policy transmission. The Governing Council is not pre-committing to a particular rate path.
Economic activity
In the first quarter of 2025 the economy grew more strongly than expected. This was partly because firms frontloaded exports ahead of expected tariff hikes. But growth was also bolstered by stronger private consumption and investment.
Recent surveys point to an overall modest expansion in both the manufacturing and services sectors. At the same time, higher actual and expected tariffs, the stronger euro and persistent geopolitical uncertainty are making firms more hesitant to invest.
The robust labour market, rising real incomes and solid private sector balance sheets continue to support consumption. Unemployment stood at 6.3% in May, close to its lowest level since the introduction of the euro. Easier financing conditions are underpinning domestic demand, including in the housing market. Over time, higher public investment in defence and infrastructure should also support growth.
More than ever, the Governing Council considers it crucial to urgently strengthen the euro area and its economy in the present geopolitical environment. Fiscal and structural policies should make the economy more productive, competitive and resilient. Governments should prioritise growth-enhancing structural reforms and strategic investment, while ensuring sustainable public finances. It is important to complete the savings and investments union and the banking union, following a clear and ambitious timetable, and to rapidly establish the legislative framework for the potential introduction of a digital euro. The Governing Council welcomes the Eurogroup’s commitment to improve the effectiveness, quality and composition of public spending and supports the efforts by European authorities to preserve the mutual benefits of global trade.
Inflation
Annual inflation stood at 2.0% in June 2025, after 1.9% in May. Energy prices went up in June but are still lower than in 2024. Food price inflation eased slightly to 3.1%. Goods inflation edged down to 0.5% in June, whereas services inflation ticked up to 3.3%, from 3.2% in May.
Indicators of underlying inflation are overall consistent with the Governing Council’s 2% medium-term target. Labour costs have continued to moderate. Year-on-year growth in compensation per employee slowed to 3.8% in the first quarter of 2025, down from 4.1% in the fourth quarter of 2024. Combined with stronger productivity growth, this led to slower growth in unit labour costs. Forward-looking indicators, including the ECB’s wage tracker and surveys on wage expectations of firms, consumers and professional forecasters, point to a further decline in wage growth.
Short-term consumer inflation expectations declined in both May and June, reversing the uptick observed in previous months. Most measures of longer-term inflation expectations continue to stand at around 2%, supporting the stabilisation of inflation around the Governing Council’s target.
Risk assessment
Risks to economic growth remain tilted to the downside. Among the main risks are a further escalation in global trade tensions and associated uncertainties, which could dampen exports and drag down investment and consumption. A deterioration in financial market sentiment could lead to tighter financing conditions and greater risk aversion, and make firms and households less willing to invest and consume. Geopolitical tensions, such as Russia’s unjustified war against Ukraine and the tragic conflict in the Middle East, remain a major source of uncertainty. By contrast, if trade and geopolitical tensions were resolved swiftly, this could lift sentiment and spur activity. Higher defence and infrastructure spending, together with productivity-enhancing reforms, would add to growth. An improvement in business confidence would also stimulate private investment.
The outlook for inflation is more uncertain than usual, as a result of the volatile global trade policy environment. A stronger euro could bring inflation down further than expected. Moreover, inflation could turn out to be lower if higher tariffs lead to lower demand for euro area exports and induce countries with overcapacity to reroute their exports to the euro area. Trade tensions could lead to greater volatility and risk aversion in financial markets, which would weigh on domestic demand and would thereby also lower inflation. By contrast, inflation could turn out to be higher if a fragmentation of global supply chains pushed up import prices and added to capacity constraints in the domestic economy. A boost in defence and infrastructure spending could also raise inflation over the medium term. Extreme weather events, and the unfolding climate crisis more broadly, could drive up food prices by more than expected.
Financial and monetary conditions
Market interest rates have increased since the Governing Council’s monetary policy meeting in June 2025, especially at longer maturities. At the same time, the Governing Council’s past interest rate cuts continue to make corporate borrowing less expensive. The average interest rate on new loans to firms declined to 3.7% in May, from 3.8% in April. The cost of issuing market-based debt also came down, falling to 3.6% in May. While the growth rate of loans to firms moderated to 2.5% in May, corporate bond issuance was stronger, growing at a rate of 3.4% in annual terms.
Credit standards for business loans were broadly unchanged in the second quarter of 2025, as reported in the July 2025 bank lending survey for the euro area. While banks’ concerns about the economic risks faced by their customers had a tightening impact on credit standards, this was broadly offset by stronger competition among lenders. Meanwhile, firms’ demand for credit increased slightly, benefiting from lower interest rates, but they remained cautious because of global uncertainty and trade tensions.
The average interest rate on new mortgages has barely changed since the start of 2025 and stood at 3.3% in May. Growth in mortgage lending edged up to 2.0% in May, in the context of a strong increase in demand, while credit standards tightened slightly in the second quarter.
Monetary policy decisions
The interest rates on the deposit facility, the main refinancing operations and the marginal lending facility remain unchanged at 2.00%, 2.15% and 2.40% respectively.
The APP and PEPP portfolios are declining at a measured and predictable pace, as the Eurosystem no longer reinvests the principal payments from maturing securities.
Conclusion
At its meeting on 24 July 2025, the Governing Council decided to keep the three key ECB interest rates unchanged. The Governing Council is determined to ensure that inflation stabilises at its 2% target in the medium term. It will follow a data-dependent and meeting-by-meeting approach to determining the appropriate monetary policy stance. The Governing Council’s interest rate decisions will be based on its assessment of the inflation outlook and the risks surrounding it, in light of the incoming economic and financial data, as well as the dynamics of underlying inflation and the strength of monetary policy transmission. The Governing Council is not pre-committing to a particular rate path.
In any case, the Governing Council stands ready to adjust all of its instruments within its mandate to ensure that inflation stabilises sustainably at its medium-term target and to preserve the smooth functioning of monetary policy transmission.
1 External environment
Uncertainty about trade policy remains high. In follow-up talks to the trade truce between the United States and China, the two sides agreed on a framework for China to speed up rare earth export licences and for the United States to ease certain export and visa restrictions. The truce is set to expire on 12 August. Amid limited progress in other ongoing trade negotiations, the United States extended the tariff pause from 9 July to 1 August. While the new US-EU framework agreement represents some progress, some uncertainty persists. The current policy environment therefore poses significant risks to the outlook, weighing on global trade and activity.
Global growth is expected to remain subdued despite a temporary boost from the tariff pause. Global GDP growth slowed to 0.7% quarter-on-quarter in the first quarter of 2025, down from 1.1% at the end of 2024. Available high-frequency indicators suggest modest growth in the coming quarters. The global composite Purchasing Managers’ Index (PMI) (excluding the euro area) edged up in June (Chart 1), but the average for the second quarter (51.4) stands below that for the first quarter (52.0). Global PMI manufacturing output declined overall in the second quarter, although it climbed back to its historical average in June (to 51.3 in June from 48.8 in May). This rebound was driven mostly by the United States, where there was an increase in stocks of finished goods following the frontloading of imports observed earlier in the year. The spike in manufacturing activity may not be sustained, as it most likely reflects a precautionary inventory build-up and not necessarily genuine growth in final demand. The global services PMI also edged down in June, although it remains above the level of the manufacturing PMI.
Chart 1
Global output PMI (excluding the euro area)
(diffusion indices)

Sources: S&P Global Market Intelligence and ECB staff calculations.
Note: The latest observations are for June 2025.
Global trade dynamics are expected to remain volatile in the near term amid pervasive policy uncertainty. Global imports (excluding the euro area) grew by 2.2% quarter-on-quarter in the first quarter, supported by substantial frontloading of imports in the United States ahead of higher tariffs. Incoming data confirm expectations of a decline in global imports in the second quarter, partly compensating for the surge observed earlier in the year. While higher US tariffs have the potential to reshape global trade flows and pose challenges for logistics, broad-based global supply chain pressures are currently contained. Nevertheless, some signs of strain are emerging at the sectoral level, for instance as regards aluminium, steel and textiles. These are, however, much more muted than during the post-COVID-19 environment. Trade policy uncertainty remains elevated and is expected to continue weighing on the outlook.
Headline inflation across members of the Organisation for Economic Co-operation and Development (OECD) continued to decline gradually. In May 2025 the annual rate of consumer price index (CPI) inflation across OECD member countries continued to decline gradually (to 4% from 4.2% in April); excluding Türkiye, it remained broadly unchanged at 2.6% (Chart 2). This was mainly driven by lower energy prices and a downtick in core inflation to 3% (from 3.1% in the previous month), while food price inflation increased slightly. The impact of higher tariffs is not visible in global headline inflation figures yet, but PMI surveys on input and output prices are signalling a slight acceleration over the near term in advanced economies, mostly driven by developments in the United States.
Chart 2
OECD CPI inflation
(year-on-year percentage changes, percentage point contributions)

Sources: OECD and ECB staff calculations.
Notes: The OECD aggregate excludes Türkiye and is calculated using OECD CPI annual weights. The latest observations are for May 2025.
Energy prices experienced strong volatility over the review period due to tensions in the Middle East. Oil prices rose 6% overall, but this increase was marked by sharp swings as prices spiked following Israeli and US strikes on Iran and subsequently declined when Iran’s retaliatory attack on a US base was perceived as largely symbolic. However, despite the rise in geopolitical tensions, the initial increase in oil prices appeared relatively subdued overall, with prices remaining below USD 80 per barrel. Two main factors likely explain this muted market reaction. First, investors seemed to assign a low probability to a blockade of the Strait of Hormuz, as such a move would be seen as self-defeating for Iran. Second, the global oil market remains well supplied, particularly following recent surprise OPEC+ production increases. With the cartel increasing supply for four consecutive months, there is a strong likelihood that OPEC+ will continue unwinding production cuts, putting downward pressure on oil prices. European gas prices also experienced a short-lived surge in line with Middle East tensions. Overall, however, they fell below initial levels and decreased by 7% over the review period, reflecting weaker Chinese liquified natural gas (LNG) imports amid strong Russian pipeline deliveries and subdued domestic demand. Food prices declined by 12%, mainly due to a drop in coffee prices as favourable weather in Brazil boosted supply expectations, while metal prices increased by 1% and experienced strong volatility from copper prices owing to frontloading demand from the United States in the face of tariffs.
US economic activity is expected to rebound in the short term before weakening later in the year. US real GDP is expected to rebound in the second quarter, after declining slightly in the first (by 0.1% quarter-on-quarter). Latest developments across main GDP components confirm this picture. For the second half of the year, growth rates are expected to remain rather low, but this is conditional on the ultimate level of tariffs. Meanwhile, the US labour market is showing signs of moderation but remains solid.
US CPI headline and core inflation increased in May, starting to show some signs of the impact of tariffs. US personal consumption expenditure (PCE) headline inflation increased to 2.3% in May (up 0.1 percentage points compared with April), while core PCE inflation reached 2.6% (up 0.1 percentage points). Latest developments in PCE inflation point to a lower effect of tariffs than previously anticipated, which may be partly related to a more delayed impact. The budget bill signed by President Trump, extending the tax cuts from his first term, is expected to exacerbate the federal budget deficit (available estimates suggest an increase in the deficit of 0.9 percentage points of GDP on average over the next ten years). As expected, the Federal Open Market Committee kept the target range for the federal funds rate unchanged at 4.25-4.5%, while the new projections anticipate higher inflation and lower growth.
China’s activity is showing renewed momentum following the US-China trade deal, but fading fiscal support is likely to slow growth later this year. China’s growth momentum held up better than expected in the second quarter, but underlying weakness is signalling a slowdown in economic activity. Real GDP growth eased slightly to 1.1% quarter-on-quarter in the second quarter, from 1.2% in the first quarter, supported primarily by a stronger-than-expected contribution from net exports. Industrial production rebounded in June, boosted by robust export growth following the partial US-China tariff de-escalation in early May. Retail sales moderated slightly but remained solid thanks to stronger goods sales under the consumer trade-in scheme, which offers subsidies to consumers replacing older durable products. In contrast, fixed asset investment growth fell short of expectations. Looking ahead, domestic demand remains weak outside policy-supported sectors, with persistent softness in the housing market and subdued consumer spending beyond subsidised goods. Chinese CPI inflation edged up slightly in June, while producer price index (PPI) inflation declined further. As US tariffs on Chinese imports remain elevated amid sluggish domestic demand, inflationary pressures are expected to remain subdued.
In the United Kingdom, GDP growth is expected to slow in the second quarter, while inflation eased only marginally. Real GDP expanded by 0.7% (quarter-on-quarter) in the first quarter of this year, supported largely by frontloading ahead of tariff and tax increases. As these idiosyncratic factors unwind, activity is expected to slow in the second quarter – a view broadly supported by recent high-frequency data. Annual headline inflation increased to 3.6% in June (from 3.4% previously) and remains significantly above the Bank of England’s target. This was driven both by persistent services inflation and by rising core inflation. The UK labour market appears to be easing, and wage growth has shown signs of moderation.
2 Economic activity
The euro area economy grew more strongly than expected in the first quarter of 2025 largely on the back of the temporary boost from frontloading exports in anticipation of the higher tariffs imposed by the US Administration. Across demand components, private consumption, total investment and exports contributed positively to growth, while changes in inventories made a marginal negative contribution. Across sectors, industrial activity was the main driver of growth, even excluding the exceptionally strong contribution from Irish production. Activity in the services and construction sectors also expanded, but at a more moderate pace. However, incoming data point to a slowdown in activity in the second quarter of 2025 as frontloading effects begin to unwind and the more domestically oriented services sector slows, while uncertainty remains elevated.[1] Looking ahead, the observed rise in protectionism, higher tariffs and trade-distorting measures, as well as the additional appreciation of the euro, are expected to continue to have a disproportionately stronger effect on the manufacturing sector than on other parts of the economy.[2] Moreover, recent developments in the Middle East have further increased geopolitical uncertainty, adding to the downside risks in the manufacturing sector. While the labour market has continued to soften, it remains robust. Overall, the projected recovery should be supported by recent purchasing power gains and more affordable credit, in part because of past interest rate cuts.
Real GDP grew by 0.6%, quarter on quarter, in the first quarter of 2025, largely reflecting the temporary boost of frontloading exports in anticipation of the higher tariffs imposed by the US Administration (Chart 3). Excluding Ireland, euro area GDP growth was 0.3%, quarter on quarter, in the first quarter of 2025. The expansion in euro area real GDP was supported by private consumption, investment and exports, while changes in inventories made a slightly negative contribution. Business investment outperformed expectations, largely owing to a surge in Irish investment in intellectual property products (IPP) and transport equipment. Net trade also contributed positively, bolstered by robust pharmaceutical exports from Ireland, likely frontloaded in anticipation of higher US tariffs. From a sectoral perspective, industry was the main contributor to growth, even excluding Ireland’s exceptional performance. Services and construction also expanded, indicating broad-based momentum in the euro area economy.
Chart 3
Euro area real GDP and its components
(quarter-on-quarter percentage changes; percentage point contributions)

Sources: Eurostat and ECB calculations.
Note: The latest observations are for the first quarter of 2025.
The incoming data confirm a notable slowdown in economic growth in the second quarter and point to moderating momentum in the near term, amid elevated uncertainty. After the strong dynamics seen in the first quarter – which also implies positive carry-over effects for the second quarter – industrial production declined sharply in April and rebounded in May, suggesting a partial reversal of frontloading effects, compounded by the appreciation of the euro and higher tariffs. The composite output Purchasing Managers’ Index (PMI) remained stable in the second quarter at a level (50.4) that suggests either slightly increasing or stagnating output. This masks a strong rise in the manufacturing output PMI to 51.3 (from 48.8 in the first quarter), with the indicator marking a quarterly average above the threshold of 50 or the first time in three years. By contrast, the PMI indicator for business activity in the services sector declined to 50.1 in the second quarter, from 51.0 in the first quarter, signalling a slowdown in this sector (Chart 4, panel a). At the same time, the PMI indicator for suppliers’ delivery times suggests that supply bottlenecks were not constraining activity up to June. Looking ahead, an environment of higher tariffs and increased protectionism – and the related uncertainty – will continue to weigh on the near-term outlook. The PMI for new orders, which is more forward-looking by nature, portrays a similar picture, suggesting there are no strong differences between perceived ongoing developments and expectations in the near term (Chart 4, panel b). The forward-looking components of the European Commission’s Economic Sentiment Indicator suggest somewhat more muted expectations than the assessment of the current situation. Following the positive, albeit temporary, effects of increased production from the frontloading of exports in the first quarter, higher tariffs might have a disproportionately adverse effect on the manufacturing sector compared with other parts of the economy in the months ahead. Moreover, the recent developments in the Middle East have added to geopolitical uncertainty, weighing on the manufacturing sector. Meanwhile, the latest ECB Corporate Telephone Survey (CTS) suggests a broad-based slowdown across manufacturing and services going forward (see Box 3).
Chart 4
PMI indicators across sectors of the economy
a) Output |
b) New orders |
|---|---|
(diffusion indices) |
(diffusion indices) |
 |
 |
Source: S&P Global Market Intelligence.
Notes: The dotted lines refer to 2015-19 averages. The latest observations are for June 2025.
Employment increased by 0.2% in the first quarter of 2025, while total hours worked declined by 0.2%. After a more muted rise of 0.1% in the fourth quarter of 2024, employment growth increased in the first quarter of 2025, standing at 0.2% (Chart 5). At the same time, the unemployment rate stood at 6.3% in May, having remained broadly at this level since mid-2024. This was accompanied by a 0.6% increase in the labour force between the fourth quarter of 2024 and the first quarter of 2025. Between the first quarter of 2024 and the first quarter of 2025, foreign workers accounted for about 42% of the labour force growth. Labour demand declined further, with the job vacancy rate falling to 2.4% in the first quarter, 0.1 percentage points below the level seen in the fourth quarter of 2024.[3]
Chart 5
Euro area employment, PMI assessment of employment and unemployment rate
(left-hand scale: quarter-on-quarter percentage changes, diffusion index; right-hand scale: percentages of the labour force)

Sources: Eurostat, S&P Global Market Intelligence and ECB calculations.
Notes: The two lines indicate monthly developments, while the bars show quarterly data. The PMI is expressed in terms of the deviation from 50, then divided by 10 to gauge the quarter-on-quarter employment growth. The latest observations are for the first quarter of 2025 for euro area employment, June 2025 for the PMI assessment of employment and May 2025 for the unemployment rate.
Short-term labour market indicators point to broadly flat employment growth in the second quarter. The monthly composite PMI employment indicator was 50.3 in June, 0.1 points higher than in May and the same as in April, suggesting broadly flat employment growth. The PMI employment indicator for services edged up from 50.9 in May to 51.0 in June, while the PMI employment indicator for manufacturing declined from 48.1 to 47.9.
Private consumption grew at a moderate pace in the first quarter of 2025 and has likely maintained a similar softer pace in the second quarter. After increasing by 0.5%, quarter on quarter, in the fourth quarter of 2024 (Chart 6, panel a), private consumption grew by 0.3% in the first quarter of 2025, reflecting modest spending on services and a renewed softening in the consumption of goods. The slowdown was mirrored by a still elevated saving rate of 15.4%, up from 15.2% in the fourth quarter of 2024. Incoming data indicate that momentum in household spending growth will continue to moderate in the short term. Services production slipped in April and remained only marginally above its level for the first quarter, while retail trade volumes held at 0.3% (on average for April-May) above the level seen over the same reference period despite a decline in May. The recent readings of the European Commission’s consumer confidence indicator edged up from the April dip, but remained overall subdued, with perceptions about the future financial situation of households and the general economy hovering well below pre‑pandemic averages (Chart 6, panel b). Similarly, an alternative consumer confidence indicator derived from the ECB’s Consumer Expectations Survey shows that developments in consumer confidence have been mainly linked to subdued expectations on the economy in recent months, with strong volatility evident in April following the recent trade tensions (see Box 1). While consumer uncertainty declined in June, the overall downbeat household sentiment was reflected in a further drop in the European Commission’s indicators of business expectations for demand in total services, retail trade and contact-intensive services. However, the ECB’s latest Consumer Expectations Survey indicates that expected holiday purchases remain strong. Looking ahead, the ongoing economic policy uncertainty – particularly in the context of global economic developments, including persisting trade tensions – should continue to weigh on households’ spending decisions. Nevertheless, consumption growth should continue to benefit from recent purchasing power gains and favourable financing conditions.
Chart 6
Private consumption, business expectations for retail trade and contact-intensive services; consumer confidence and uncertainty
a) Consumption and business expectations |
b) Consumer confidence and uncertainty |
|---|---|
(quarter-on-quarter percentage changes; standardised percentage balances) |
(standardised percentage balances) |
 |
 |
Sources: Eurostat, European Commission and ECB calculations.
Notes: Business expectations for retail trade (excluding motor vehicles) and expected demand for contact-intensive services refer to the next three months; “contact-intensive services” refer to accommodation, travel and food services. The contact-intensive services series is standardised for the period from 2005 to 2019 and consumer uncertainty is standardised for the period from April 2019 to May 2025 with respect to the average for the fourth quarter of 2021, owing to data availability, while all other series are standardised for the period from 1999 to 2019. The latest observations are for the first quarter of 2025 for private consumption, July 2025 for consumer confidence and June 2025 for all other items.
Business investment reflected frontloading in anticipation of higher tariffs in the first quarter of 2025; a partial reversal of these effects is expected in the second half of the year. Euro area business investment, excluding volatile Irish intangibles, rose by 0.9%, quarter on quarter, in the first quarter of 2025. Across assets, business investment in IPP (excluding Ireland) made the largest positive contribution to this figure, compensating the drop in machinery and equipment. The positive momentum seems to have continued in the second quarter, with industrial production in the capital goods sector growing by 1.4% in April-May compared with the average for the first quarter 2025. However, the CTS suggests that frontloading was an important factor in the dynamics of the capital goods sector in the first half of 2025 (see Box 3), implying that it was not necessarily driven by improvements in underlying fundamentals. Evidence from surveys points to a subdued picture for the second half of 2025, in line with a weak growth outlook, amid higher tariffs, a stronger euro and persisting elevated uncertainty. The CTS indicates a likely moderation as firms adopt a “wait and see” approach.[4] Likewise, the bank lending survey (BLS) suggests only a moderate net increase in financing needs for investment purposes in the third quarter of 2025. Other soft metrics, such as confidence indicators (Chart 7, panel a), remain subdued as well. Similarly, the continued high uncertainty and limited incentives to invest – as reflected by a low Tobin’s Q – point to a weak investment outlook.
Chart 7
Real investment dynamics and survey data
a) Business investment |
b) Housing investment |
|---|---|
(quarter-on-quarter percentage changes; percentage balances and diffusion index) |
(quarter-on-quarter percentage changes; percentage balances and diffusion index) |
 |
 |
Sources: Eurostat, European Commission (EC), S&P Global Market Intelligence and ECB calculations.
Notes: Lines indicate monthly developments, while bars refer to quarterly data. The PMIs are expressed in terms of the deviation from 50. In panel a), business investment is measured by non-construction investment excluding Irish intangibles. Short-term indicators refer to the capital goods sector. The European Commission’s capital goods confidence indicator is normalised for the 1999-2019 average and standard deviation of the series. In panel b), the line for the European Commission’s activity trend indicator refers to the weighted average of the building and specialised construction sectors’ assessment of the trend in activity over the preceding three months, rescaled to have the same standard deviation as the PMI. The line for PMI output refers to housing activity. The latest observations are for the first quarter of 2025 for investment and June 2025 for PMI output and the European Commission’s indicators.
Housing investment expanded in the first quarter of 2025 and likely continued to recover in the second quarter. After growing by 0.1%, quarter on quarter, in the fourth quarter of 2024, housing investment increased by 0.7% in the first quarter of 2025, marking the end of a prolonged decline that started in the first quarter of 2022. According to high-frequency indicators, housing investment likely continued to recover in the second quarter. Building construction production and specialised construction activities in April and May were, on average, 1.7% above the levels recorded in the first quarter (Chart 7, panel b). However, survey-based indicators, such as the European Commission’s indicator for recent trends in building and specialised construction activities and the PMI housing output, deteriorated from April to June, thus indicating moderate growth prospects for the second quarter. Looking ahead, housing investment should benefit further from improved housing affordability, thanks to more favourable financing conditions and recovering incomes. This is also reflected in buoyant demand for housing loans, according to the July BLS. However, a modest rise in residential building permits in the first quarter of 2025, as well as a marked drop in the European Commission's assessment of order books for building and specialised construction companies in June, point to limited housing activity in the months ahead. Overall, housing investment is set to remain on a path of moderate recovery.
Euro area exports of goods remained stable in May. Following a peak in March – driven mainly by Irish exports of chemicals to the United States – exports returned to their usual levels in April and May. Looking ahead, survey indicators suggest a continued contraction in services exports, with manufacturing exports close to neutral. The appreciation of the euro is likely to further dampen the competitiveness of exports. Adding to the challenges, euro area exporters continue to face elevated trade policy uncertainty, amid discussions on a new trade agreement with the US Administration imposing a 15% tariff celling on EU goods. Meanwhile, euro area imports decreased moderately in May, driven by the United States. Imports from China have grown significantly since the beginning of the year, intensifying competition with domestic producers (see Box 2). With Chinese overcapacity still high and US tariffs possibly encouraging trade diversion, additional price pressure on euro area imports seems likely in the coming months.
Overall, the outlook for euro area activity remains highly uncertain owing to increased tariffs and persistent geopolitical tensions, despite some significant tailwinds. A high level of uncertainty is likely to further reduce confidence among households and firms. At the same time, rising protectionism at the global level, high tariffs and trade-distorting measures, as well as the further appreciation of the euro, are posing a threat to the euro area outlook. Recent developments in the Middle East have contributed to elevated geopolitical uncertainty. Nevertheless, the recent purchasing power gains from, and the continued resilience of, the labour market will allow households to spend more, while government investment related to defence and infrastructure spending will increasingly support growth (see Box 7). This, together with more favourable financing conditions, should keep the economy resilient to global shocks.
3 Prices and costs
Euro area headline inflation stood at 2.0% in June 2025, slightly up from 1.9% in May.[5] This increase was mainly due to higher energy prices, which more than offset a decline in food inflation. Most measures of underlying inflation are overall consistent with the ECB’s 2% medium-term target. Domestic price pressures have continued to ease, mainly owing to moderating wage growth. Annual growth in compensation per employee stood at 3.8% in the first quarter of 2025, down from 4.1% in the last quarter of 2024. Combined with stronger productivity growth, this led to slower growth in unit labour costs. Most measures of longer-term inflation expectations continue to stand at around 2%, supporting the stabilisation of inflation around the target.
Euro area headline inflation, as measured in terms of the Harmonised Index of Consumer Prices (HICP), increased slightly to 2.0% in June from 1.9% in May (Chart 8). The increase was driven by less negative energy inflation, which more than offset the decline in food inflation. The inflation outcome for the second quarter of 2025 (2.0%) was in line with the June 2025 Eurosystem staff macroeconomic projections for the euro area.
Chart 8
Headline inflation and its main components
(annual percentage changes; percentage point contributions)

Sources: Eurostat and ECB calculations.
Notes: “Goods” refers to non-energy industrial goods. The latest observations are for June 2025.
Energy prices continue to be volatile: energy inflation remained negative in June but increased to -2.6%, up from -3.6% in May. This increase mainly reflects a positive base effect caused by lower transport fuel prices in June 2024. The detailed breakdown showed an increase in the annual inflation rate for transport fuels – related to rising oil prices – which was only partially offset by lower electricity and gas prices.
Food inflation decreased slightly to 3.1% in June 2025, down from 3.2% in May. This decline was driven by a decrease in the annual rate of change of processed food prices (to 2.6% in June from 2.9% in May), which was not fully compensated for by the increase in unprocessed food prices (to 4.6% in June from 4.3% in May). The increase in unprocessed food prices was mainly due to a higher annual inflation rate for meat and fruit that was only partially offset by a lower inflation rate for vegetables. Meanwhile, the decrease in the annual rate of growth of processed food prices can primarily be attributed to decreasing pressure from tobacco price inflation. That said, the annual rate for processed food excluding the tobacco component also decreased slightly to 2.1% in June, from 2.2% in May.
HICP inflation excluding energy and food (HICPX) remained unchanged at 2.3% in June. Non-energy industrial goods (NEIG) inflation edged down to 0.5% in June, from 0.6% in May. This decline was offset by slightly higher services inflation, which stood at 3.3% in June after 3.2% in May. The increase in services inflation was driven by higher transport services inflation as well as rising annual inflation in the communication and recreation components. The decrease in NEIG inflation is consistent with the ongoing moderate price pressures from low import price growth and a stronger euro. A slowdown in semi-durable goods inflation drove the decline in the annual rate of NEIG inflation, although this was partly counterbalanced by stronger inflation in durable goods.
Most measures of underlying inflation are overall consistent with the ECB’s 2% medium-term target (Chart 9).[6] The bulk of the indicator values ranged from 2.1% to 2.6%. Underlying inflation was unchanged according to all permanent exclusion-based measures. Some temporary exclusion-based measures, such as the weighted median and the 10% trimmed mean, continued to ease in June. Regarding model-based measures, the Supercore indicator (which comprises HICP items sensitive to the business cycle) was unchanged at 2.6% in June. Meanwhile the Persistent and Common Component of Inflation (PCCI) increased slightly to 2.2% in June after 2.1% in May. Domestic inflation was unchanged at 3.7%, remaining at a persistently high level.
Chart 9
Indicators of underlying inflation
(annual percentage changes)

Sources: Eurostat and ECB calculations.
Notes: HICPXX stands for HICP excluding energy, food, travel-related items, clothing and footwear. The grey dashed line represents the ECB’s inflation target of 2% over the medium term. The latest observations are for June 2025.
In May pipeline price pressures for goods continued to moderate at the early stages of the pricing chain, while those at the later stages remained broadly stable (Chart 10). At the early stages of the pricing chain, producer price inflation for domestic sales of intermediate goods eased further to 0.3% in May, down from 0.4% in April. At the later stages, the annual growth rate of producer prices for non-food consumer goods remained unchanged at 1.4%. The annual growth rate of import prices for non-food consumer goods rose slightly to 0.3% in May, up from 0.2% in April, while import price inflation for intermediate goods declined to -1.0% from ‑0.4%. The annual growth rate of producer prices for manufactured food edged up to 2.1% from 2.0% over the same period, suggesting more persistent cost pressures in the food manufacturing segment. Import price inflation for manufactured food was unchanged at 7.4% in May, potentially reflecting elevated international food commodity prices. Overall, the data suggest that while pipeline pressures on consumer goods prices have broadly eased, the food segment shows signs of more persistent inflationary dynamics.
Chart 10
Indicators of pipeline pressures
(annual percentage changes)

Sources: Eurostat and ECB calculations.
Note: The latest observations are for May 2025.
Domestic cost pressures, as measured by growth in the GDP deflator, continued to ease in the first quarter of 2025, with the annual growth rate slowing to 2.3% from 2.6% in the previous quarter (Chart 11). This reflects a substantial decline from the peak of 6.4% in the first quarter of 2023. The deceleration in the GDP deflator was due to smaller contributions from unit labour costs (1.7 percentage points, down from 2.0 percentage points in the previous quarter) and unit taxes (0.4 percentage points, down from 0.7 percentage points). By contrast, the contribution from unit profits increased to 0.2 percentage points after a negative contribution of -0.1 percentage points in the fourth quarter of 2024. The moderation in unit labour costs reflects a combination of lower wage growth, measured in terms of compensation per employee (3.8% in the first quarter of 2025 after 4.1% in the previous quarter), and an increase in productivity growth (to 0.8% from 0.6% in the previous quarter). The easing of compensation per employee continues to be broad-based across sectors and countries. Moreover, its slowing growth rate reflects a large drop in negotiated wages growth (2.5% in the first quarter of 2025, down from 4.1% in the previous quarter), which was partially offset by an increase in the wage drift.[7] Looking ahead, the ECB’s wage tracker, which incorporates data on wage agreements negotiated up to the end of June 2025, suggests that wage growth pressures will continue easing throughout 2025. This further moderation is confirmed by the latest survey indicators on wage growth, such as the ECB’s Corporate Telephone Survey, in which wage growth expectations stand at 3.3% and 2.8% in 2025 and 2026 respectively[8].
Chart 11
Breakdown of the GDP deflator
(annual percentage changes; percentage point contributions)

Sources: Eurostat and ECB calculations.
Notes: Compensation per employee contributes positively to changes in unit labour costs. Labour productivity contributes negatively. The latest observations are for the first quarter of 2025.
In the period from the June Governing Council meeting, survey-based and market-based indicators of longer-term inflation expectations remained stable, with most standing at around 2% (Chart 12, panel a). In both the ECB Survey of Monetary Analysts (SMA) for July 2025 and the ECB Survey of Professional Forecasters (SPF) for the third quarter of 2025, median and average longer-term inflation expectations were unchanged at 2%. Longer-term market-based measures of inflation compensation (based on the HICP excluding tobacco) have edged up since the June Governing Council meeting, with the five‑year forward inflation-linked swap rate five years ahead standing at around 2.1%. Model-based estimates of genuine inflation expectations, excluding inflation risk premia, indicate that market participants continue to expect longer-term inflation to be around 2%.
Market-based measures of near-term inflation compensation, as indicated by inflation fixings, remain below 2% but edged higher over the review period. Following the Governing Council’s decision in June to lower the key ECB interest rates by 25 basis points, these short to medium-term measures of market expectations for HICP inflation excluding tobacco moved upwards and have continued to rise modestly since then. Investors currently expect inflation to remain around 2% in the coming months before declining around the turn of the year and rebounding to settle slightly below 2% by mid-2026. Looking further ahead, the one-year forward inflation-linked swap rate one year ahead also increased somewhat, reaching approximately 1.8%.
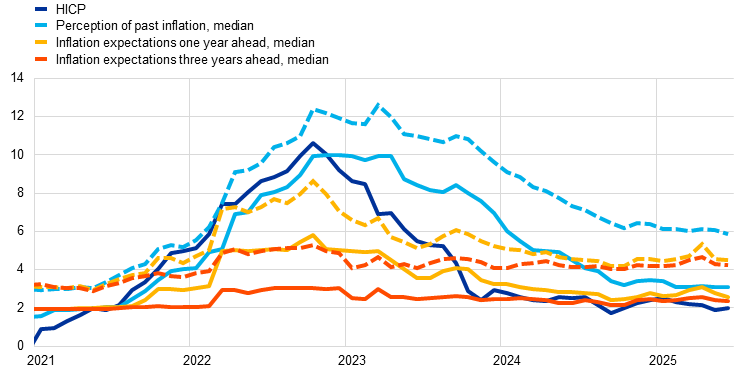
Short-term consumer inflation expectations declined in both May and June, reversing the uptick observed in previous months (Chart 12, panel b). The June 2025 ECB Consumer Expectations Survey (CES) reported that median expectations for headline inflation over the next year declined to 2.6%, after 2.8% in May and 3.1% in April, while inflation expectations for three years ahead remained unchanged at 2.4%. The moderation in short-term inflation expectations may reflect an unwinding in inflation uncertainty and some improvement in the economic sentiment of the survey’s participants compared with the April round.
Chart 12
Headline inflation, inflation projections and expectations
a) Headline inflation, market-based measures of inflation compensation, inflation projections and survey-based indicators of inflation expectations
(annual percentage changes)

b) Headline inflation and ECB Consumer Expectations Survey
(annual percentage changes)
Sources: Eurostat, LSEG, Consensus Economics, ECB (SMA, SPF, CES), Eurosystem staff macroeconomic projections for the euro area, June 2025, and ECB calculations.
Notes: In panel a) the market-based measures of inflation compensation series are based on the one-year spot inflation rate, the one-year forward rate one year ahead, the one-year forward rate two years ahead and the one-year forward rate three years ahead. The observations for market-based measures of inflation compensation are for 23 July 2025. Inflation fixings are swap contracts linked to specific monthly releases in euro area year-on-year HICP inflation excluding tobacco. The SPF for the third quarter of 2025 was conducted between 1 and 3 July 2025. The SMA for July 2025 was conducted between 7 July and 9 July. The cut-off date for the Consensus Economics long-term forecasts was 14 July 2025. The June 2025 Eurosystem staff macroeconomic projections for the euro area were finalised on 21 May 2025 and the cut-off date for the technical assumptions was 14 May 2025. In panel b), for the CES, the dashed lines represent the mean and the solid lines represent the median. The latest observations are for June 2025.
4 Financial market developments
During the review period from 5 June to 23 July 2025, movements in euro area financial markets were relatively muted overall, despite ongoing geopolitical tensions and renewed trade uncertainties. The euro short-term rate (€STR) traded within a narrow range following the Governing Council’s decision at its meeting on 5 June 2025 to lower the three key ECB interest rates by 25 basis points. The forward curve remained broadly stable, with market participants pricing in around 25 basis points of cumulative interest rate cuts by the end of the year. Long-term sovereign bond spreads relative to risk-free rates narrowed slightly. This reflected broadly unchanged euro area sovereign yields alongside a simultaneous increase in the overnight index swap (OIS) rate amid expectations of increased public debt issuance. Corporate bond spreads in the euro area tightened overall, reflecting a recovery in risk appetite after the widening of spreads in April. Euro area equity markets, by contrast, declined modestly over the review period after rebounding previously on the back of the US tariff announcement on 2 April. The decline points to lingering investor caution, particularly in sectors that are sensitive to trade-related risks. In foreign exchange markets, the euro appreciated further against the US dollar and on a trade-weighted basis.
Euro area risk-free rates remained broadly stable over the review period, despite persistently elevated trade and geopolitical uncertainties. The €STR stood at 1.92% at the end of the review period, following the Governing Council’s widely anticipated decision at its June 2025 meeting to lower the three key ECB interest rates by 25 basis points. Excess liquidity decreased by around €53 billion to €2,655 billion. This was due mainly to the decline in the portfolios of securities held for monetary policy purposes, as the Eurosystem is no longer reinvesting the principal payments from maturing securities in its asset purchase programmes. The near-term risk-free forward curve shifted upwards on the day of the Governing Council’s decision and then traded within a narrow range during the review period. This was despite heightened uncertainty surrounding the expiry of the 90-day tariff pause on 9 July – subsequently extended to 1 August – and elevated geopolitical tensions in the Middle East, which contributed to a temporary rise in oil prices and a short-lived increase in financial market volatility but had little impact on the market-implied path of ECB policy rates. By the end of the review period, market participants were pricing in cumulative interest rate cuts of around 25 basis points by the end of 2025. The OIS curve steepened, with rates remaining broadly unchanged at horizons of up to five years and increasing by 6 basis points, to 2.5%, at the ten-year maturity.
Long-term euro area sovereign bond yield spreads relative to risk-free rates narrowed slightly over the review period (Chart 13). The ten-year GDP-weighted euro area sovereign bond yield remained broadly unchanged at 3.0% during the review period, while the ten-year OIS rate rose by 6 basis points. As a result, the overall change in sovereign risk premia was modest, as reflected in the narrowing of spreads by 7 basis points, with broadly similar yield movements across individual euro area sovereigns. The growth in nominal risk-free rates was driven partly by a rise in inflation compensation and partly by higher real rates. Outside the euro area, there were minimal changes in the ten-year US Treasury yield and the ten-year UK sovereign bond yield, which settled at 4.4% and 4.6% respectively at the end of the review period.
Chart 13
Ten-year sovereign bond yields and the ten-year OIS rate based on the €STR
(percentages per annum)

Sources: LSEG and ECB calculations.
Notes: The vertical grey line denotes the start of the review period on 5 June 2025. The latest observations are for 23 July 2025.
Euro area equity prices fell modestly during the review period, reflecting lingering investor caution amid ongoing economic uncertainties. Following the rebound in equity prices after the US tariff announcement on 2 April, broad stock market indices edged down by 0.4% during the review period, with non-financial corporations (NFCs) recording losses of 0.1% and financial corporations gaining 1.4%, indicating cautious sentiment overall. While the energy sector benefited from higher oil prices, equity prices declined in several other sectors. Those with significant exposure to international trade fared worst, despite the apparent calm in the markets amid ongoing trade negotiations. By contrast, following the correction seen in April, US equity markets notably outperformed their euro area counterparts, with the broad indices rebounding by 7.0%. This strong performance was supported by the 7.0% gains recorded by both financial corporations and NFCs. The growth in US NFC equities was underpinned by improved investor sentiment, reflecting signs of progress in trade negotiations, and by continued strong demand for technology stocks, particularly those associated with artificial intelligence.
Euro area corporate bond spreads tightened after the pronounced widening observed in April, reflecting a recovery in investor risk appetite. At the start of the review period, spreads remained broadly stable as investors assessed the potential implications of renewed global trade tensions for corporate earnings and economic activity. Later on, however, as sentiment began to improve, they narrowed by 8 and 10 basis points in the investment-grade and high-yield segments respectively. This tightening was broad-based across both financial and non-financial issuers.
In foreign exchange markets, the euro appreciated further against the US dollar and on a trade-weighted basis (Chart 14). During the review period, the nominal effective exchange rate of the euro – as measured against the currencies of 41 of the euro area’s most important trading partners – strengthened by 2.1%. The euro appreciated by 3.0% against the US dollar, supported by relatively robust euro area fundamentals alongside concerns over US fiscal sustainability amid ongoing trade uncertainties. The euro’s upward trajectory generally persisted in June despite escalating geopolitical risks, including the Israel-Iran conflict. From early July, this upward trajectory reversed slightly against the US dollar and in trade-weighted terms as investors reassessed the expected scope of further US monetary policy easing on the back of stronger than expected inflation data. The euro’s appreciation was relatively broad-based, strengthening against most major and emerging market currencies. It recorded notable gains against the Japanese yen (4.5%), driven by US tariff-related uncertainties, as well as Japan’s political and monetary policy outlook. Conversely, it depreciated slightly, by 0.7%, against the Swiss franc, reflecting continued demand for the currency as a safe haven in this period of heightened uncertainties.
Chart 14
Changes in the exchange rate of the euro vis-à-vis selected currencies
(percentage changes)

Source: ECB calculations.
Notes: EER-41 is the nominal effective exchange rate of the euro against the currencies of 41 of the euro area’s most important trading partners. A positive (negative) change corresponds to an appreciation (depreciation) of the euro. All changes have been calculated using the foreign exchange rates prevailing on 23 July 2025.
5 Financing conditions and credit developments
In May bank funding costs continued to fall, reflecting lower policy rates. Average interest rates on new loans to firms declined to 3.7% in May, whereas average interest rates for households on new mortgages have changed little since the start of the year and stood at 3.3%. Growth in loans to firms and households was broadly stable in May but remained far below historical averages, also reflecting elevated uncertainty. Over the review period from 5 June to 23 July 2025, the cost to firms of both equity financing and market-based debt financing decreased marginally. According to the ECB’s July 2025 euro area bank lending survey, credit standards for loans to firms remained broadly unchanged in the second quarter of 2025, while loan demand increased slightly. Credit standards for housing loans tightened slightly, while housing loan demand continued to increase strongly. In the ECB’s Survey on the Access to Finance of Enterprises for the second quarter of 2025, which was conducted between 30 May and 27 June 2025, firms continued to report a decline in bank interest rates, while indicating a slight tightening of other lending conditions. The annual growth rate of broad money (M3) remained stable at 3.9% in May.
Bank funding costs decreased slightly in May 2025, reflecting lower policy rates. The composite cost of debt financing for euro area banks, i.e. the index which measures marginal bank funding costs, fell slightly in May (Chart 15, panel a), reflecting the ECB’s policy rate cuts. The decline was driven by deposit and interbank rates. At the same time, bank bond yields have fluctuated at levels around 3.0% since the beginning of the year, amid higher volatility in financial markets, notably since April, related in part to uncertainty about US tariffs (Chart 15, panel b). The composite deposit rate fell slightly in May, to 1.0%, down from its peak of 1.4% in May 2024. This decline has mainly been driven by lower interest rates on the time deposits of firms and households. Overnight deposit rates remained broadly stable and, despite remaining significant, the gap between interest rates on time deposits and overnight deposits for both firms and households narrowed further.
Chart 15
Composite bank funding costs in selected euro area countries
(annual percentages)

Sources: ECB, S&P Dow Jones Indices LLC and/or its affiliates, and ECB calculations.
Notes: Composite bank funding costs are an average of new business costs for overnight deposits, deposits redeemable at notice, time deposits, bonds and interbank borrowing, weighted by their respective outstanding amounts. Average bank funding costs use the same weightings but are based on rates for outstanding deposits and interbank funding, and on yield to maturity at issuance for bonds. Bank bond yields are monthly averages for senior tranche bonds. The latest observations are for May 2025 for the composite cost of debt financing for banks (panel a) and 23 July 2025 for bank bond yields (panel b).
Bank lending rates for firms continued to decline, while mortgage rates for households remained broadly unchanged, reflecting differences in loan fixation periods. In May 2025 lending rates for new loans to non-financial corporations (NFCs) fell by 15 basis points to stand at 3.65%, a decline of around 1.6 percentage points from their October 2023 peak (Chart 16, panel a). This decline was broad-based across the largest euro area countries; it was driven by short-term loans with a maturity of up to one year, in line with falling short-term market rates. Lending rates on outstanding amounts also decreased, although to a lesser extent. The spread between interest rates on small and large loans to firms increased to 59 basis points in May, with some variation across countries, significantly above its low of 31 basis points in January 2025 but significantly below its long-term average. For households, lending rates on new loans for house purchase remained broadly stable at 3.30% in May, around 80 basis points below their November 2023 peak, albeit with some variation across countries (Chart 16, panel b). This development reflects some variability across fixation periods and countries, with rates declining on loans with fixation periods of up to five years while increasing for loans with longer fixation periods. Lending rates on outstanding amounts also remained stable at 2.40%. The disparity between lending rates for households and those for firms reflects differences in loan fixation periods. Household loans typically have longer fixation periods in many jurisdictions, making them less sensitive to fluctuations in short-term market rates.
Chart 16
Composite bank lending rates for firms and households in selected euro area countries
(annual percentages)
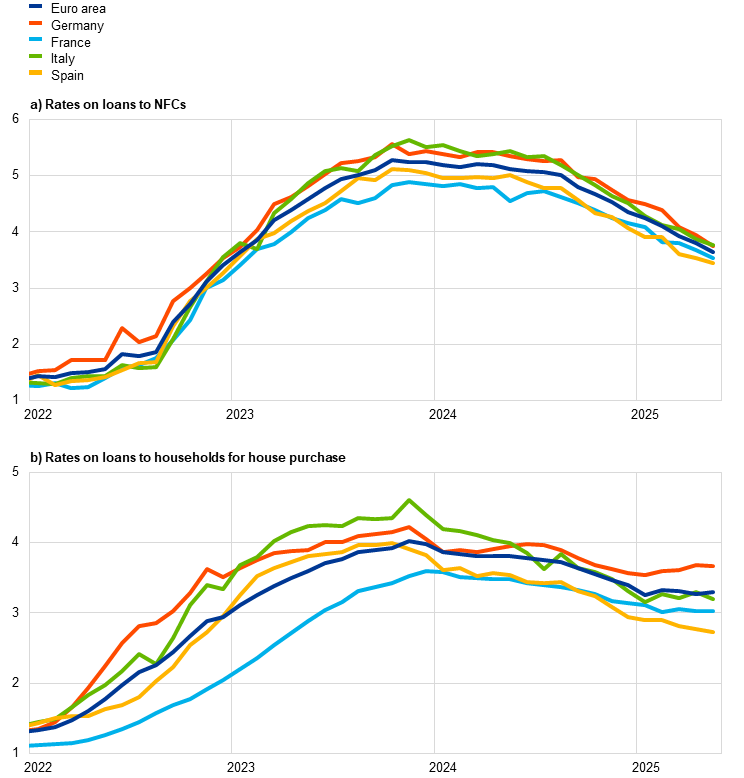
Sources: ECB and ECB calculations.
Notes: Composite bank lending rates are calculated by aggregating short and long-term rates using a 24-month moving average of new business volumes. The latest observations are for May 2025. In panel a), NFCs stands for non-financial corporations.
Over the review period from 5 June to 23 July 2025, the cost to firms of both equity financing and market-based debt financing decreased marginally. The overall cost of financing for NFCs – i.e. the composite cost of bank borrowing, market-based debt and equity – declined slightly in May compared with the previous month and stood at 5.9% (Chart 17).[9] This was the result of a decrease in all components of the overall cost of financing except for the cost of long-term borrowing from banks, which remained unchanged. Daily data for the review period from 5 June to 23 July 2025 show a further slight decline in the cost of both equity financing and market-based debt financing. A compression of corporate bond spreads in both the investment grade and high-yield segments more than offset a slight increase in long-term risk-free rates, leading to a slight decline in the cost of market-based debt. Similarly, the lower cost of equity financing over the same period reflected a decline in the equity risk premium which, albeit small, was larger than the rise in the long-term risk-free rate, as approximated by the ten-year overnight index swap rate.
Chart 17
Nominal cost of external financing for euro area firms, broken down by component
(annual percentages)

Sources: ECB, Eurostat, Dealogic, Merrill Lynch, Bloomberg, LSEG and ECB calculations.
Notes: The overall cost of financing for non-financial corporations is based on monthly data and is calculated as a weighted average of the long and short-term costs of bank borrowing (monthly average data), market-based debt and equity (end-of-month data), based on their respective outstanding amounts. The latest observations are for 23 July 2025 for the cost of market-based debt and the cost of equity (daily data) and May 2025 for the overall cost of financing and the cost of borrowing from banks (monthly data).
Growth in loans to firms and households was broadly stable in May but remained far below historical averages. The annual growth rate of bank lending to firms edged down to 2.5% in May 2025, after 2.6% in April, thus remaining well below its historical average of 4.3% since January 1999 (Chart 18, panel a). This development reflects weaker short-term dynamics in firms borrowing from banks amid a strong net issuance of corporate debt securities. The annual growth rate of corporate debt issuance rebounded to 3.4% in May from 2.2% in April. The annual growth rate of loans to households edged up to reach 2.0% in May after 1.9% in April, although this level is still significantly below the historical average of 4.1% (Chart 18, panel b). Loans for house purchase were still the primary driving force behind this upward trend, with consumer credit remaining stable at an annual growth rate of 4.3% in May. However, the recovery in loans to households appears to have lost momentum, as indicated by weaker monthly flows driven by mortgages. Other forms of household lending, including loans to sole proprietors, remained weak. Household sentiment regarding credit access improved in May. According to the ECB’s Consumer Expectations Survey for May, the percentage of households perceiving tighter credit access decreased, but still outweighed the percentage of respondents perceiving easier credit access. Looking ahead, households expect credit access to ease somewhat over the next 12 months.
Chart 18
MFI loans in selected euro area countries
(annual percentage changes)

Sources: ECB and ECB calculations.
Notes: Loans from monetary financial institutions (MFIs) are adjusted for loan sales and securitisation; in the case of non-financial corporations (NFCs), loans are also adjusted for notional cash pooling. The latest observations are for May 2025.
According to the July 2025 euro area bank lending survey, banks reported broadly unchanged credit standards for loans or credit lines to firms in the second quarter of 2025 and a slight net tightening of credit standards for housing loans (Chart 19). Credit standards for loans or credit lines to euro area firms remained broadly unchanged in the second quarter of 2025, whereas banks had indicated in the previous survey round that they expected a net tightening. Perceived risks related to the economic outlook continued to contribute to a tightening of credit standards, whereas competition had an easing impact. Euro area banks mostly reported no specific additional tightening impact on their credit standards from geopolitical uncertainty and trade tensions, although they intensified their monitoring of the most exposed sectors and firms. By contrast, banks reported a small net tightening of credit standards for housing loans and a more pronounced net tightening for consumer credit. Changes in risk perceptions and the risk tolerance of banks were the main drivers of the tightening for both household loan segments. Banks reported a small net increase in the share of rejected loan applications for firms, a more pronounced net increase for consumer credit and a broadly unchanged share for housing loans. For the third quarter of 2025, euro area banks expect unchanged credit standards for loans to firms, a slight easing for housing loans and a further tightening for consumer credit.
In the second quarter of 2025 banks reported a slight increase in loan demand for firms and a further substantial increase in housing loan demand. Loan demand for firms was supported in the second quarter of 2025 by declining lending rates, while the impact of fixed investment and inventories and working capital was neutral. Several banks referred to a dampening impact on loan demand from global uncertainty and the related trade tensions. For housing loans, the strong increase in demand was primarily driven by declining interest rates, improved housing market prospects and, to a lesser extent, rising consumer confidence. Consumer credit demand was also supported by declining interest rates, together with other factors, offsetting the negative contributions from lower consumer confidence and spending on durable goods. For the third quarter of 2025, banks expect demand from firms for loans to increase further and demand for housing loans to increase substantially, while demand for consumer credit is expected to remain broadly unchanged.
Chart 19
Changes in credit standards and net demand for loans to NFCs and loans to households for house purchase
(net percentages of banks reporting a tightening of credit standards or an increase in loan demand)

Source: Euro area bank lending survey.
Notes: NFCs stands for non-financial corporations. For survey questions on credit standards, “net percentages” are defined as the difference between the sum of the percentages of banks responding “tightened considerably” and “tightened somewhat” and the sum of the percentages of banks responding “eased somewhat” and “eased considerably”. For survey questions on demand for loans, “net percentages” are defined as the difference between the sum of the percentages of banks responding “increased considerably” and “increased somewhat” and the sum of the percentages of banks responding “decreased somewhat” and “decreased considerably”. The diamonds denote expectations reported by banks in the current round. The latest observations are for the second quarter of 2025.
According to banks’ responses to the ad hoc questions, access to funding improved slightly, while perceived risks to credit quality had a tightening impact on credit standards. In the second quarter of 2025 banks’ access to retail and wholesale funding improved slightly, driven by short-term retail funding, money markets and debt securities, and remained broadly unchanged for securitisations. Banks indicated that changes in excess liquidity held with the Eurosystem in the first half of 2025 had a neutral impact on bank lending conditions. By contrast, euro area banks reported a tightening impact of non-performing loan ratios and other credit quality indicators on their credit standards across all loan categories in the second quarter of 2025. Developments in credit standards and loan demand were heterogeneous across the main economic sectors in the first half of 2025. Credit standards tightened in commercial real estate, manufacturing, wholesale and retail trade and, to a lesser extent, in construction, while easing slightly across most services (excluding financial services and real estate) and in residential real estate.
According to the survey findings, climate risks and related policy measures contributed to tighter lending conditions for firms with high carbon emissions. Euro area banks indicated that firms’ climate-related risks and measures to cope with climate change continued to have a net tightening impact on lending policies for loans to high-emitting firms (i.e. firms that contribute significantly to climate change and have not yet started, or have made little progress, with transition) over the past 12 months. Both physical risk and firms’ transition risk had a moderate net tightening impact on banks’ lending policy, while climate-related fiscal support continued to have an easing impact. Banks also reported a net increase in demand for loans to firms in transition and green firms owing to climate change, while uncertainty about future climate regulation was perceived as an important obstacle to loan demand. Based on a new question on the impact of climate change on housing loans, banks reported an easing impact on credit standards for buildings with high energy performance and a tightening impact for buildings with low energy performance over the past 12 months. The physical risk of real estate was, however, an important driver of further net tightening in lending conditions overall. Banks also reported a positive impact of climate change on loan demand for buildings with high and medium energy performance but a negative impact for those with low energy performance. Investment into energy performance was the key factor for climate-related loan demand, supported by preferential lending rates for increasing sustainability, whereas uncertainty about future climate regulation was reported as a dampening factor for loan demand.
In the latest Survey on the Access to Finance of Enterprises (SAFE), firms reported a further decline in bank interest rates amid a continued tightening of other loan conditions. In the second quarter of 2025 a net 14% of firms reported a decrease in bank interest rates, up from a net 12% in the previous quarter. Notably, a higher net percentage of large firms (31%) observed a decline in interest rates, whereas a net 2% of small and medium-sized enterprises (SMEs) reported an increase. At the same time, a net 16% of firms (down from 24% in the first quarter of 2025) pointed to a rise in other financing costs, such as charges, fees and commissions, and a net 11% of firms (down from 13%) reported stricter collateral requirements.
Chart 20
Changes in euro area firms’ bank loan needs, current and expected availability and financing gap
(net percentages of respondents)

Sources: ECB (SAFE) and ECB calculations.
Notes: SMEs stands for small and medium-sized enterprises. Net percentages are the difference between the percentage of firms reporting an increase in availability of bank loans (needs and expected availability respectively) and the percentage reporting a decrease in availability in the past three months. The indicator of the perceived change in the financing gap takes a value of 1 (-1) if the need increases (decreases) and availability decreases (increases). If firms perceive only a one-sided increase (decrease) in the financing gap, the variable is assigned a value of 0.5 (-0.5). A positive value for the indicator points to a widening of the financing gap. Values are multiplied by 100 to obtain weighted net balances in percentages. Expected availability has been shifted forward by one period to allow for a direct comparison with realisations. The figures refer to Pilot 2 and Rounds 30 to 35 of the SAFE (October-December 2023 to April-June 2025).
Firms reported that their need for bank loans and the availability of such loans were broadly unchanged, with a further improvement in availability anticipated over the next three months (Chart 20). The net percentage of firms reporting an increase in the availability of bank loans was 1% (compared with a net 1% indicating a decline in the previous quarter). SMEs reported a smaller increase in bank loan availability relative to large firms. These developments are consistent with the broadly unchanged credit standards highlighted in the euro area bank lending survey during the same period. The bank loan financing gap indicator – an index capturing the difference between changes in needs and availability – remained broadly stable compared with the previous quarter at a net ‑1%. Looking ahead, firms expect a further improvement in the availability of bank financing over the next three months.
Growth in broad money (M3) remained stable in May 2025, amid elevated uncertainty (Chart 21). Annual M3 growth was unchanged at 3.9% in May. Annual growth of narrow money (M1), which comprises the most liquid components of M3, rose to 5.1% in May from 4.7% in April. This can be attributed to an increase in the annual growth rate of overnight deposits held by firms and households to 5.6% in May, up from 5.2% in April, likely reflecting a preference of investors for liquidity in an uncertain environment and lower interest rates on savings deposits. Regarding the various counterparts, broad money growth was mainly driven by net foreign inflows, pointing to greater interest in euro-denominated assets from foreign investors since April. Bank lending to firms and households made a modest contribution to money creation, and net issuance of longer-term bank bonds rebounded following weaker issuance in April. At the same time, the ongoing contraction of the Eurosystem balance sheet continued to weigh on M3 growth.
Chart 21
M3, M1 and overnight deposits
(annual percentage changes, adjusted for seasonal and calendar effects)

Source: ECB.
Note: The latest observations are for May 2025.
1 Consumer confidence and household consumption decisions
Prepared by Adam Baumann, Luca Caprari, Maarten Dossche, Georgi Kocharkov and Omiros Kouvavas
Consumer confidence plays an important role in determining economic activity. Thanks to timely availability and close co-movement with economic activity, analysts and policymakers closely monitor consumer confidence indicators to help them assess the strength of the economy (Barsky and Sims, 2012; Dees and Brinca, 2013; Ludvigson, 2004). They typically summarise information about consumers’ perceptions of current and future economic conditions and expectations for households’ financial situations and their spending plans. In this box, we present a new consumer confidence indicator (CCI) derived from the ECB’s Consumer Expectations Survey (CES) and use additional microdata to explore the relationship between consumer confidence and actual spending at the household level.
More2 What does increasing competition from China mean for euro area employment?
Prepared by Clémence Berson, Claudia Foroni, Vanessa Gunnella and Laura Lebastard
Increased competition from China across global export markets has affected the euro area labour market in recent years. As China has moved up the value chain, its exports have increasingly challenged European firms both domestically and in third-country markets (Banin et al., 2025). This competition is no longer confined to low-cost goods; it extends to high value-added sectors, such as vehicles and specialised machinery (Al-Haschimi et al., 2024). Elevated US tariffs on China may further increase competition for euro area producers if Chinese exporters expand or seek new markets in Europe. This box analyses the implications of increased Chinese competition for euro area employment by exploring how shifts in labour demand are linked to changes in import penetration and trade patterns.
More3 Main findings from the ECB’s recent contacts with non‑financial companies
Prepared by Alex Melemenidis, Richard Morris and Moreno Roma
This box summarises the findings of recent contacts between ECB staff and representatives of 72 leading non-financial companies operating in the euro area. The exchanges took place between 23 June and 2 July 2025.[10]
Contacts reported a slowdown in activity in recent months as tariffs, geopolitical tensions and the resulting uncertainty dented business and consumer confidence (Chart A and Chart B). The feedback from contacts was consistent with very modest growth in both the second and third quarters. While manufacturing orders had been recovering in the first months of the year, many contacts indicated a loss of momentum at some point during the second quarter. Growth in services also appeared to have slowed down.
More4 Real wage catch-up in the euro area
Prepared by Colm Bates, Katalin Bodnár, Vasco Botelho and Flavie Rousseau
Real wages in the euro area have largely recovered from their decline during the period of high inflation in 2022. Nominal wages have recently risen faster than prices. As a result, real wages, which are measured by deflating nominal wages by cost-of-living indicators, are now approaching levels seen before the inflation surge. For example, in the first quarter of 2025, compensation per employee deflated by the Harmonised Index of Consumer Prices (HICP) was only around 0.5% below its level in the fourth quarter of 2021 – at the start of the inflation surge – while in the fourth quarter of 2022 it had dropped 5% below that level (Chart A, panel a). Other wage indicators deflated by the HICP or the private consumption deflator show similar catch-up trends. The recent gradual restoration of lost purchasing power should limit wage demands in the future. However, workers may still perceive a loss in living standards. For instance, they would have continued to perceive a considerable real wage gap in the first quarter of 2025 if they had compared their nominal wages with the prices of frequent out-of-pocket purchases (FROOPP) augmented with HICP energy prices rather than with the overall HICP.[11]
More5 Uncertainty in seasonally adjusted services inflation: the role of Easter and travel
Prepared by Martin Eiglsperger, Mario Porqueddu and Elisabeth Wieland
When assessing inflation developments, the ECB complements the monitoring of annual inflation rates by analysing measures of “momentum” to gauge shorter-term developments. Momentum is defined as the three-month-on-three-month percentage change in the seasonally and calendar-adjusted price index (annualised for comparability).[12] Annualised shorter-term rates need to be interpreted with caution, not least on account of exceptional effects that may considerably increase uncertainties pertaining to seasonal and calendar adjustment, as illustrated in this box.
More6 Higher defence spending and its impact on household expectations
Prepared by Adam Baumann, Cristina Checherita-Westphal, Georgi Kocharkov, Steffen Osterloh
Fiscal policies in the euro area are increasingly shaped by a focus on defence spending in response to heightened geopolitical tensions. The February 2025 Munich Security Conference, the launch of the European Commission’s Preparedness Union Strategy in March and the conclusions of the June 2025 NATO Summit all underscored EU governments’ commitment to increasing defence spending.[13] This box uses data from the ECB Consumer Expectations Survey (CES) rounds conducted in February and May 2025 to assess euro area household expectations regarding defence spending, in terms of both its economic impact in their respective countries and its implications for their personal financial well-being.
More7 Fiscal aspects of European defence spending: implications for euro area macroeconomic projections and associated risks
Prepared by Cristina Checherita-Westphal, Christian Huber, Marta Rodríguez-Vives and Georg Müller
Government defence spending in the EU is expected to rise in response to heightened geopolitical tensions, particularly following Russia’s unjustified invasion of Ukraine. This trend was reinforced by the NATO summit of 24-25 June 2025, at which NATO allies made a commitment to spend 5% of GDP on defence annually by 2035, of which 3.5% on core defence (up from the current guideline of 2%) and 1.5% on defence and security-related spending.[14] For most EU countries, the new target implies a substantial increase in defence spending. Evidence suggests a strong correlation between current levels of defence spending across EU NATO members and proximity to Russia – as an indicator of most imminent geopolitical risks – but also between defence spending and fiscal space (Chart A). According to the latest available NATO data for its members, defence spending at EU level stood at 2.0% of GDP in 2024, while the euro area aggregate was 1.9%.[15] Shortly after the Munich Security Conference in February 2025, the European Commission announced its “Readiness 2030” plan, which allows EU Member States more flexibility under the EU fiscal governance framework to facilitate the necessary shift in spending, as well as proposals to increase spending efficiency and reduce fragmentation in the EU defence sector through joint procurement.[16] This box explores the implications of the new defence plans announced since the Munich Security Conference for euro area baseline projections and the risks around the baseline over the period 2025-27, as reflected in the June 2025 Eurosystem staff macroeconomic projections.[17]
More1 Unveiling the hidden costs of critical dependencies
Prepared by Maria-Grazia Attinasi, Lukas Boeckelmann, Rinalds Gerinovics and Baptiste Meunier
Trade integration, a key driver of economic growth in recent decades, is at a crossroads amid growing geopolitical rivalries and protectionist policies. By liberalising cross-border flows of goods, services, investment and technology, the multilateral rules-based trading system boosted growth and reduced global inequalities (Frankel and Romer, 1999; Feyrer, 2019). A corollary of this deeper globalisation has been the increasing sensitivity of domestic output to external shocks (Chart 1), particularly in the 1990s and the 2000s – a period marked by the proliferation of multilateral trade agreements (e.g. the North American Free Trade Agreement in 1992) and the establishment of the World Trade Organization in 1995, which China joined in 2001. While greater trade openness has enabled countries to cushion domestic shocks through greater reliance on foreign demand (International Relations Committee, 2023), it has also heightened their exposure to global economic disturbances. Recent global shocks – such as the COVID-19 pandemic and Russia’s unjustified war against Ukraine – have brought this duality into sharp focus. As a result, trade integration is viewed increasingly through the lens of vulnerability and strategic risk, prompting a shift towards more inward-looking economic policies by many governments. This shift, exemplified by events such as Brexit (2016), the US-China trade tensions (2018-19) and the recent US tariff hikes, represents a paradigm change in global trade relations, characterised by growing scepticism towards trade liberalisation and increasing strain on the open global trading system.
More2 Activity and price discovery in euro area inflation-linked swap markets
Prepared by Benjamin Böninghausen
Inflation-linked swap (ILS) rates are an important measure of private agents’ inflation expectations. Inflation expectations play a central role in the conduct of monetary policy at the ECB, whose primary objective is to maintain price stability in the euro area. These expectations matter as they influence private agents’ consumption and investment decisions, wage and price setting and consequently actual inflation. Among the different measures of private agents’ inflation expectations that are monitored by the ECB, the inflation compensation required by informed investors in financial markets plays an important role. As informed investors use financial products to hedge their exposure to, or express their views on, future inflation, the prices for those products can provide useful and particularly timely indications of possible shifts in the inflation outlook. In the euro area, the rates on ILS contracts – i.e. products that exchange a fixed payment in return for realised inflation over a given horizon in the future – are the most prominent market-based measures of inflation compensation in the monitoring toolkit for monetary policy purposes.[18]
More3 Cash is alive… and somewhat young? Decoupling age, period and cohort from euro cash use
Prepared by Rebecca Clipal and Alejandro Zamora-Pérez
A central puzzle motivating modern payments research is the divergence between decades of predictions about a cashless society and the empirical reality of the enduring role cash plays. This persistence of cash is paradigmatic in the case of the euro. The value of euro cash circulation reached €1.59 trillion by the end of 2024, representing around 10% of euro area GDP (a similar share to that of a decade earlier). [19] While the transactional use of cash – estimated to account for roughly 20% of this circulation (Zamora-Pérez, 2021) – has clearly diminished with ongoing digitalisation, this trend has been slower than predicted and the demise of cash has not materialised. To the contrary, evidence shows that cash was used in about 50% of physical point-of-sale transactions in 2024, remaining people’s most frequently used payment method with the widest merchant acceptance (European Central Bank, 2024a; European Central Bank, 2024b). This resilience contradicts decades of predictions about the death of cash (Shy, 2023), which suggest that other factors beyond simple transactional efficiency influence overall demand for physical currency.
More https://www.ecb.europa.eu/pub/pdf/ecbu/ecb.eb_annex202505~e14d3f89e3.en.pdf© European Central Bank, 2025
Postal address 60640 Frankfurt am Main, Germany
Telephone +49 69 1344 0
Website www.ecb.europa.eu
All rights reserved. Reproduction for educational and non-commercial purposes is permitted provided that the source is acknowledged.
For specific terminology please refer to the ECB glossary (available in English only).
The cut-off date for the statistics included in this issue was 23 July 2025.
PDF ISSN 2363-3417, QB-01-25-046-EN-N
HTML ISSN 2363-3417, QB-01-25-046-EN-Q
Legal Disclaimer:
EIN Presswire provides this news content "as is" without warranty of any kind. We do not accept any responsibility or liability for the accuracy, content, images, videos, licenses, completeness, legality, or reliability of the information contained in this article. If you have any complaints or copyright issues related to this article, kindly contact the author above.
